Exploring Critical Metals in South America
Latest Releases
May 30th 2025Max Resource Corp. Announces Participation in THE Mining Investment Event, Quebec City, June 3-5, 2025
April 22nd 2025Max Resource Reports High-Grade Iron Ore (Fe) Results from Florália Hematite DSO Project in Minas Gerais, Brazil
March 30th 2025Max Resource Reports High-Grade Assays from the Florália Hematite DSO Project in Minas Gerais, Brazil
View All Releases
About Max Resource
Max Resource Corp. (TSXV: MAX) is a mineral exploration company exploring the world’s next sediment-hosted copper district in Colombia and DSO iron ore within the Iron Quadrangle in Brazil, hosting some of the largest DSO mines in the world.
Florália DSO Hematite Geological Target:50 to 70mt at 55-61% Fe*
*Max cautions investors the potential quantity and grade of the iron ore is conceptual in nature, and further cautions there has been insufficient exploration to define a mineral resource, and Max is uncertain if further exploration will result in the target being delineated as a mineral resource. Hematite mineralization tonnage potential estimation is based on in situ high-grade outcrops and interpreted and modelled magnetic anomalies. Density value used for the estimate is 2.8t/m³. Hematite sample grades range between 55-61%Fe. Hematite mineralization tonnage potential estimation is based on in situ hematite outcrop interpreted and modelled magnetic anomalies. Density value used for the estimate is 2.5t/m3. The 58 channel samples were collected for chemical analysis from in situ outcrops in previously mined slopes of industrial materials. Channel samples weighed in average 14 kg. Chemical analysis was performed at ALS Laboratories. Metal Oxides are determined using XRF analysis. Fusion disks are made with pulped samples and the addition of a borate-based flux. Max did not insert standards or blanks in the assay stream and is relying on ALS's lab QA/QC.
Colombia
Sierra Azul Copper-Silver
The Sierra Azul Project sits along the Colombian portion of the world’s largest producing copper belt (Andean belt), with world-class infrastructure and the presence of global majors (Glencore and Chevron). Max has an Earn-In Agreement (“EIA”) with Freeport-McMoRan Exploration Corporation (“Freeport”), a wholly owned affiliate of Freeport-McMoRan Inc. (“NYSE: FCX”) relating to the Sierra Azul Project. Under the terms of the EIA, Freeport has been granted a two-stage option to acquire up to an 80% ownership interest in the Sierra Azul Project by funding cumulative expenditures of C$50 million and making cash payments to Max of C$1.55 million. Max is the operator of the initial stage. The USD $4.2 million 2024 exploration program for the Sierra Azul Project is funded by Freeport.
View Project Page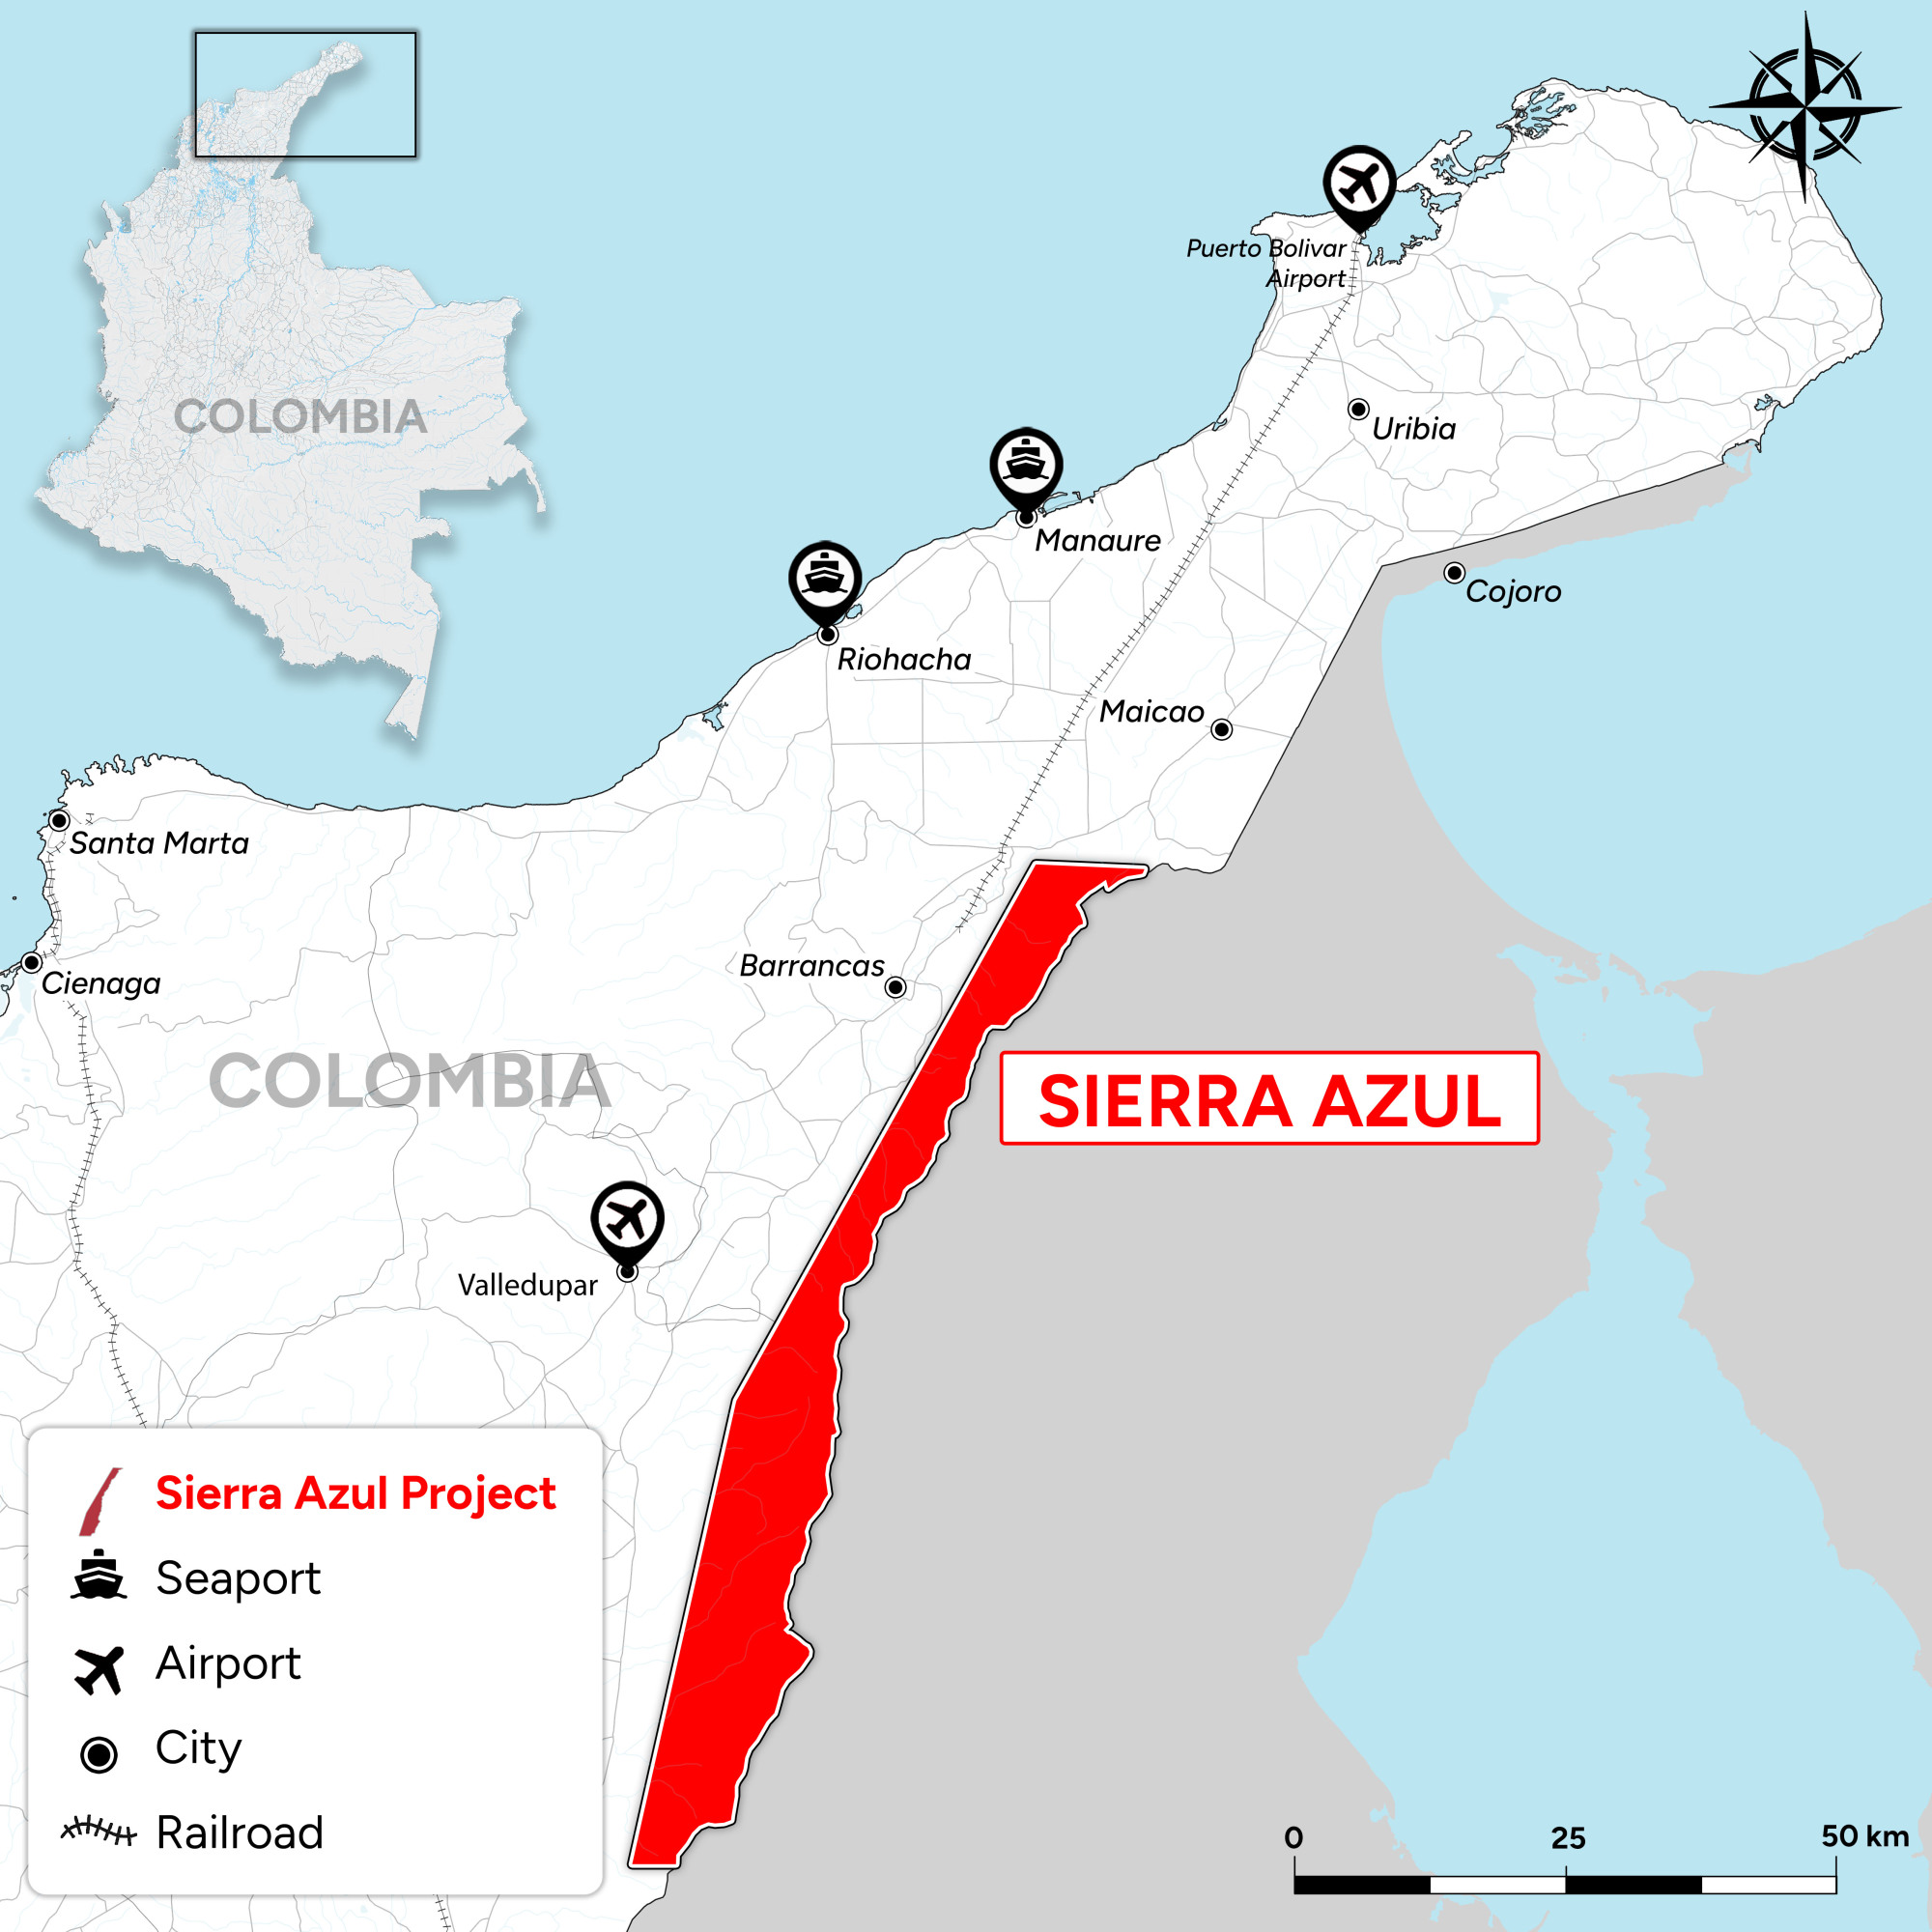
On May 30, 2024, the Company received exchange approval for an earn-in agreement with Freeport-McMoRan Inc. for a two-stage option to acquire up to an 80% ownership interest in the project by funding cumulative expenditures of C$50 million and making cash payments to Max of C$1.55 million. 2024 exploration at Sierra Azul is fully funded by Freeport-McMoRan Inc. and includes:
- Geophysical, mapping and geochemistry to identify multiple drill targets and build the model of the 200 x 20-km Cesar Copper-Silver basin
- Analyzing 10,000-line-km high-resolution magnetic / radiometric survey
- 28 priority targets identified to date
Minas Gerais, Brazil
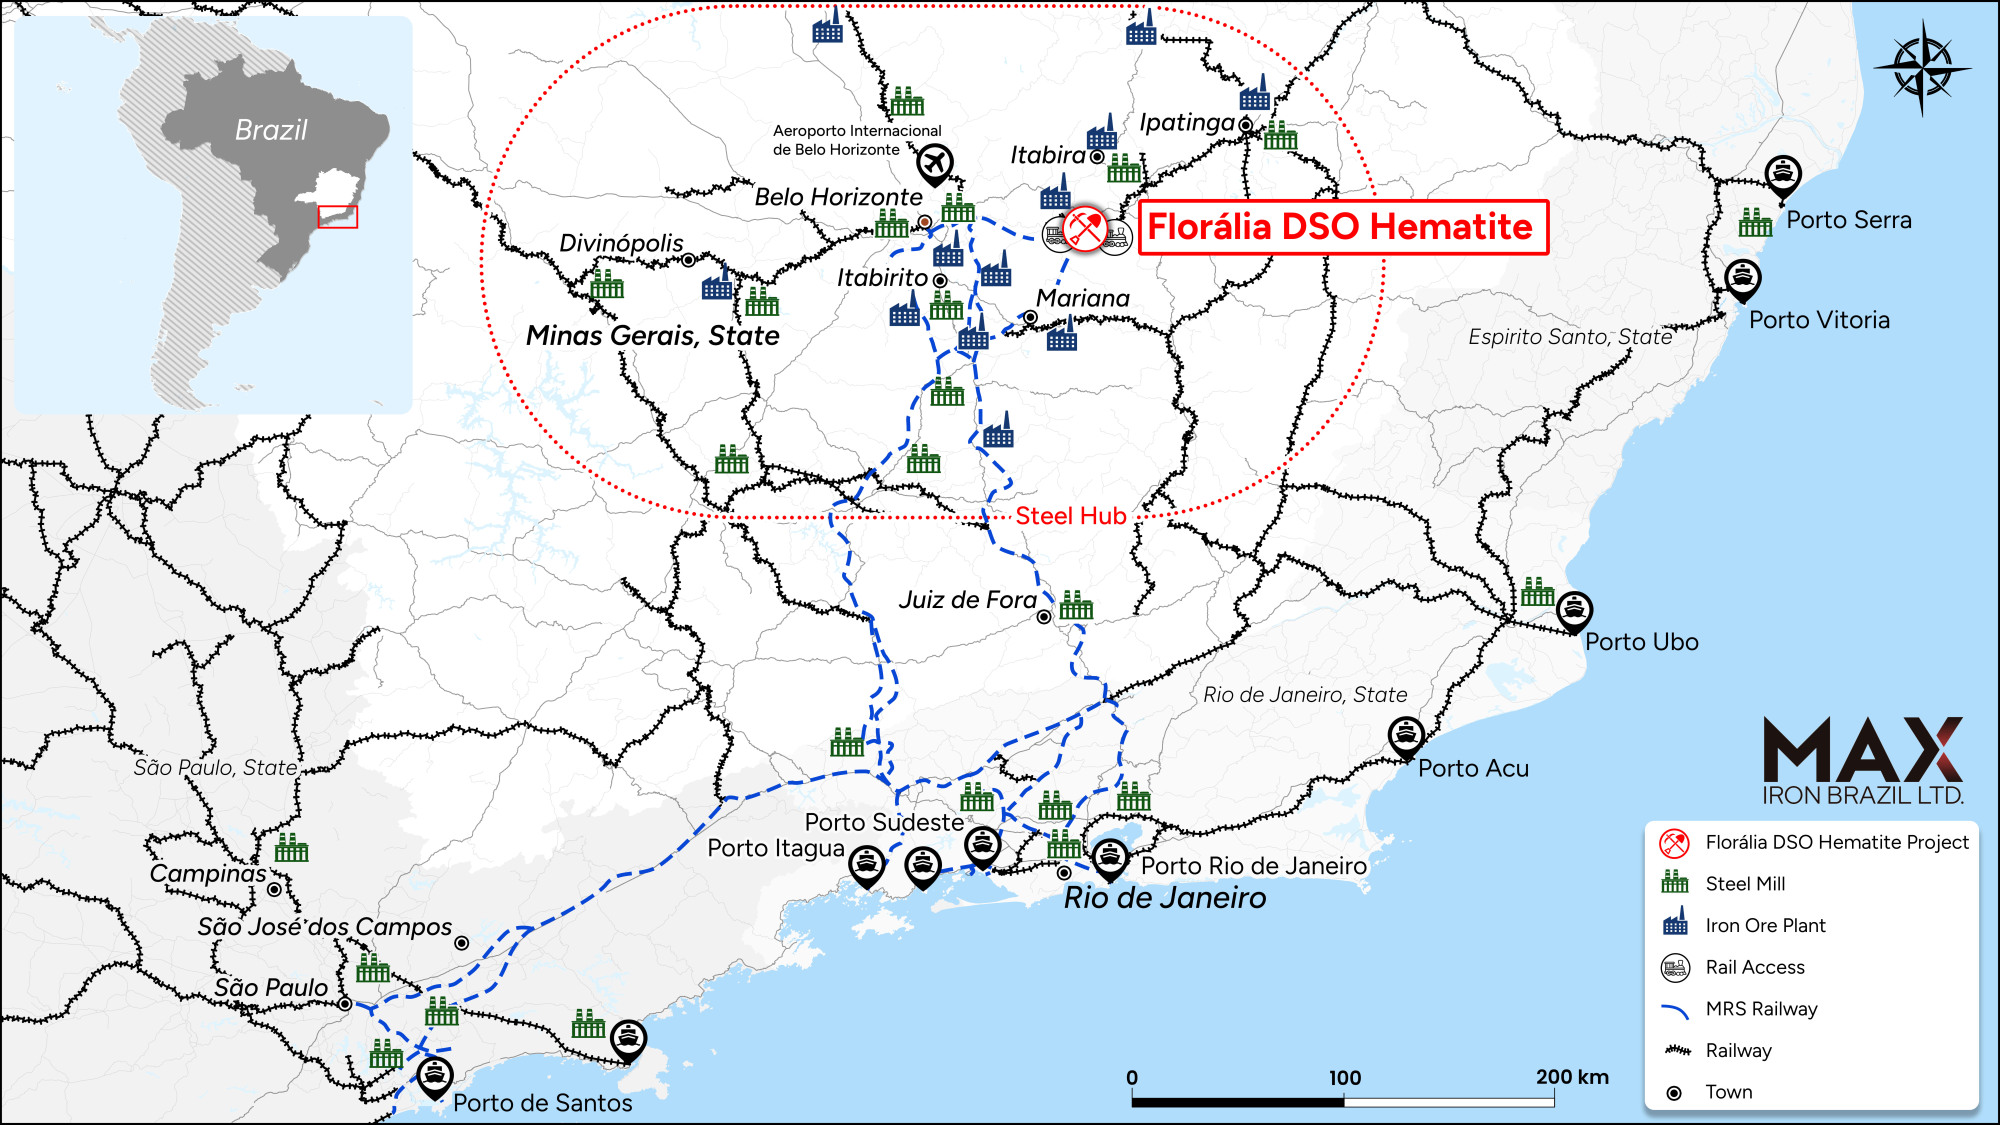
Florália DSO Hematite
The Florália DSO Hematite project is located 67km east of the city of Belo Horizonte, Minas Gerais, Brazil’s largest iron ore and steel producing state. Upon successful exploration and development, Florália DSO has the potential of producing hematite direct shipping ore (DSO) through conventional drill and blast open pit mining, followed by crushing and screening to produce lump and fines products for the domestic market and/or shipping to overseas markets. Max’s technical team has reviewed new drone magnetics and channel sampling data and has significantly expanded the Florália hematite geological target from 8 to 12 million tons at 58% Fe to 50 to 70 million tonnes at 55% to 61% Fe.
Max Resource has also established Max Iron Brazil Ltd., an Australian subsidiary, to manage the Florália DSO Project through existing Canadian and Brazilian entities. The company has completed initial private funding and is pursuing a public listing on the Australian Stock Exchange* (ASX), with Max Resource maintaining majority ownership.
*Max cautions investors the Florália Hematite potential quantity and grade of the iron ore is conceptual in nature, and further cautions there has been insufficient exploration to define a mineral resource, and Max is uncertain if further exploration will result in the target being delineated as a mineral resource. In 2023, Gold miner Jaguar Mining (TSX: JAG) conducted mapping consisting of 41 channel samples collected over 151m of accumulated length. Using a density of 2.71 g/cm3 resulted in definition of an estimated geological target of: 2,971,233 to 4,496,333 m3 or 8,052,041 to 12,184,160t at average of 58% Fe. The source of the exploration information on the Florália Property is “Depósito Florália Oportunidade para minerrio de ferro by Jaguar Mining Inc. The document is undated.
Qualified Person: The Company's disclosure of a technical or scientific nature in this company’s news releases and website are reviewed and approved by Tim Henneberry, P.Geo (British Columbia), a member of the Max Resource advisory board, who serves as a qualified person under the definition of National Instrument 43-101. DSO and Iron Ore are widely recognized industry terms, however they are not meant to imply Florália hosts mineral reserves or resources as defined in National Instrument 43-101. Further, Florália does not currently hosts mineral reserves or mineral resources.